
Filter by
SubjectRequired
LanguageRequired
The language used throughout the course, in both instruction and assessments.
Learning ProductRequired
LevelRequired
DurationRequired
SkillsRequired
SubtitlesRequired
EducatorRequired
Results for "chart.js"

Coursera Project Network
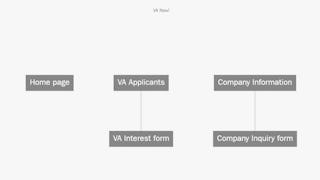
Skills you'll gain: Process Flow Diagrams, User Accounts, Organizational Structure, Recruitment, Data Visualization, Business Process Modeling, Creativity
Coursera Project Network
Skills you'll gain: Wireframing, Mockups, Web Design, Information Architecture, Collaborative Software, User Experience Design, Content Management
 Status: Preview
Skills you'll gain: Matplotlib, Plot (Graphics), Statistical Visualization, Data Visualization Software, Scientific Visualization, Interactive Data Visualization, Scatter Plots, Jupyter, Histogram, Box Plots, Graphing, Computer Programming, Integrated Development Environments, Animations
 Status: Free Trial
University of Pennsylvania
Skills you'll gain: Data Storytelling, Data Presentation, Data Visualization Software, Data Visualization, Tableau Software, Presentations, Interactive Data Visualization, Verbal Communication Skills, Data Analysis, Pivot Tables And Charts, Scatter Plots, Stakeholder Communications, Spatial Analysis, Trend Analysis
 Status: Free
Coursera Project Network
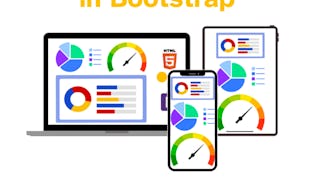
Skills you'll gain: Chart.js, Responsive Web Design, Bootstrap (Front-End Framework), UI Components, Dashboard, HTML and CSS, Data Visualization, Cascading Style Sheets (CSS), Web Design, Web Applications, User Interface (UI), Web Development

Skills you'll gain: Marketing Strategies, Customer Analysis, Big Data, Forecasting, Customer Insights, Predictive Analytics, Analytics, Target Audience, Data Analysis, Marketing Analytics, Artificial Intelligence, Predictive Modeling, Artificial Intelligence and Machine Learning (AI/ML), Applied Machine Learning, Google Cloud Platform, Generative AI

Skills you'll gain: Django (Web Framework), Model View Controller, Authentications, Chart.js, Data Import/Export, Web Development, Data Modeling, Cascading Style Sheets (CSS), Responsive Web Design, Javascript, User Interface (UI), Development Environment, Hypertext Markup Language (HTML), Data Validation
Searches related to chart.js
In summary, here are 7 of our most popular chart.js courses
- Utiliser LucidChart pour petites entreprises: Coursera Project Network
- Build a Website Map with Jumpchart: Coursera Project Network
- Visualizing Data & Communicating Results in Python: Codio
- Data Viz Using Tableau & Presenting With Storytelling: University of Pennsylvania
- Responsive Design in Bootstrap: Create an Admin Dashboard: Coursera Project Network
- Gemini for Data Scientists and Analysts-Português Brasileiro: Google Cloud
- Django with Tailwind CSS: Packt


